Adjust the displayed temperature range and color palette in IRT Cronista to make relevant temperature differences easier to see. These settings change the appearance of the infrared image, not its measured temperatures.
Use the controls in the Temperature Scale window for the focused infrared image. Show this window using View > Temperature Scale.
Temperature range
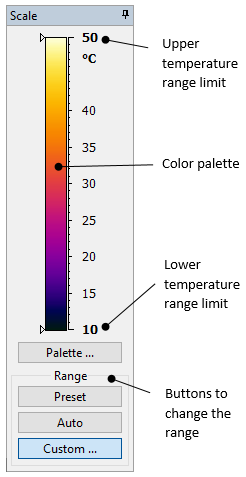
The displayed temperature range defines how temperatures map to palette colors. Temperatures at or below the lower limit use the bottom palette color, and temperatures at or above the upper limit use the top color. Temperatures between the limits use the colors between them. The span is the difference between the upper and lower limits; it is not the camera's measurement range.
In the illustrated scale, the range is 10–50 °C, so the span is 40 °C. The selected palette runs from a dark color at the lower limit to pale yellow at the upper limit.
Under Range, select one of these modes:
·Preset: Uses the temperature range stored by the camera. If the camera did not store a range, the automatic range limits are used.
·Auto: IRT Cronista calculates the display limits from the image histogram. The limits may exclude sparsely represented extreme temperatures; they do not necessarily match the image's minimum and maximum temperatures.
·Custom: Uses limits that you specify to emphasize a temperature subrange.
Custom temperature range
Use Custom to focus on a temperature interval. A narrower span can make small differences within that interval easier to distinguish, while temperatures outside it use the end colors of the palette.
To set the range limits:
1.Click Custom in the Temperature Scale window.
2.Enter the upper bound of the desired range in Upper Limit.
3.Enter the lower bound of the desired range in Lower Limit.
4.Click OK.
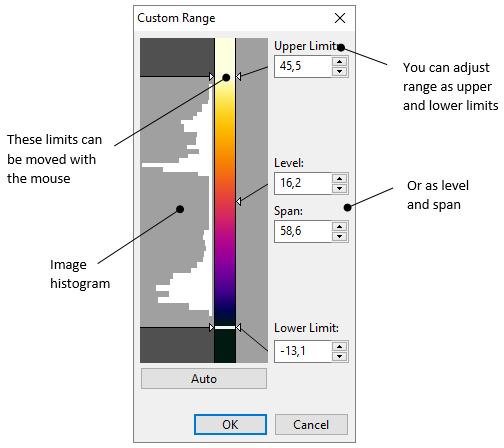
Alternatively, use Level and Span in the Custom Range dialog. Level is the midpoint of the range, and span is its width. For example, a level of 30 °C and a span of 40 °C give limits of 10 °C and 50 °C.
You can also drag the limit markers beside the color bar. The histogram shows how frequently temperatures occur in the image. Click Auto to calculate limits automatically, or OK to apply your changes.
Palette
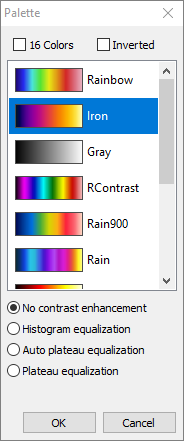
A palette maps temperatures to colors. IRT Cronista provides multiple palettes so that you can select the one that best reveals the relevant temperature differences.
To change the palette:
1.Click Palette in the Temperature Scale window.
2.Select a palette from the list.
3.Click OK.
16-color and inverted palettes
To use a palette with 16 colors, select the 16 Colors check box.
To reverse the palette colors, select the Inverted check box.
These check boxes are in the Palette dialog. Click OK to apply your changes.
Image contrast enhancement
Availability: Ultimate edition
Without contrast enhancement, colors are distributed evenly across the selected temperature range. Small differences can be difficult to see when an area receives only a narrow part of the palette. IRT Cronista provides the following contrast-enhancement methods:
·Histogram equalization: Distributes palette colors according to how frequently temperatures occur in the image.
·Plateau equalization: Limits the influence of frequently occurring temperatures on the color distribution. Use the slider below the method options to adjust the plateau level.
·Auto plateau equalization: Adjusts the plateau level automatically.
To select a contrast-enhancement method:
1.Open the Palette dialog.
2.Select a method below the palette list.
3.If you select Plateau equalization, adjust the slider as needed.
4.Click OK.
Select No contrast enhancement to turn enhancement off.
Figure 1. No contrast enhancement |
Figure 2. Histogram equalization |
Figure 3. Auto plateau equalization |
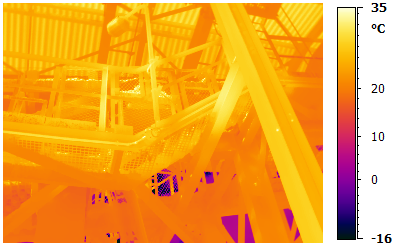
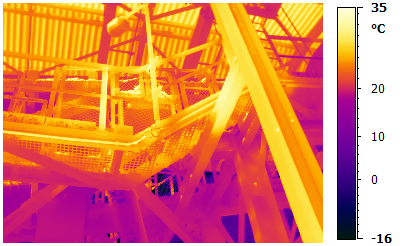
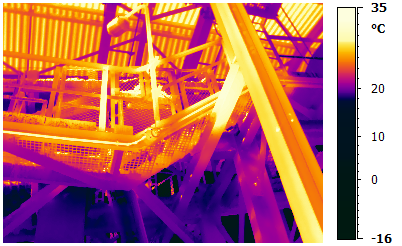
The figures show the same image and temperature range with different contrast-enhancement methods. Each method distributes the palette colors differently.
Note: Contrast enhancement changes only the palette colors. It does not change the image temperature values. |
See also: