Analyzer mode arranges the analyzed infrared image, measurement tools, image information, and graphs in one workspace. To switch to Analyzer mode, click Analyzer on the main toolbar:

The following image identifies the main Analyzer mode areas:
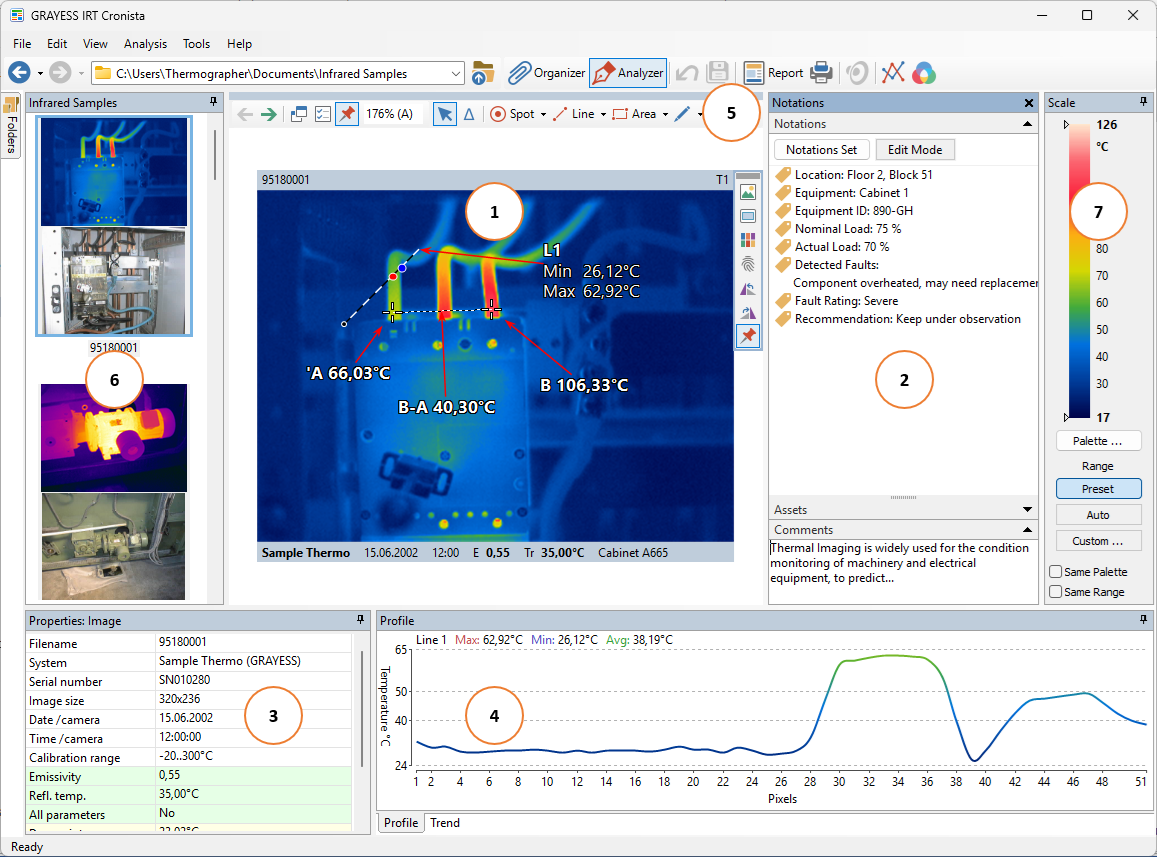
1.Analysis area. Displays the focused infrared image and its measurement objects.
2.Notations window. Displays notations, assets, and comments for the focused image.
3.Properties window. Displays properties of the active measurement object or, when no object is active, the focused image.
4.Graphs area. Displays line profiles, area histograms, and trends when applicable.
5.Analysis toolbar. Provides measurement-object and image-view tools.
6.Image Thumbnails window. Displays the infrared images in the current folder.
7.Scale window. Displays the temperature scale, palette, and related controls.
The main menu, main toolbar, address bar, and Folders window work as they do in Organizer mode. See Organizer mode overview.
Analysis area and toolbar
The analysis area occupies the center of the workspace. It displays the focused infrared image and the measurement objects placed on it. Use the analysis toolbar to select objects and add spots, lines, areas, notes, arrows, and other supported objects. See Measurement objects.
Notations
The Notations window displays the focused image's notations and comments. It can also display associated assets. For information about notations, see Notations overview.
Properties
The Properties window displays image or measurement-object properties. When a measurement object is active, the window displays that object's properties. When no object is active, it displays the focused image's properties.
Graphs
The graphs area displays the data associated with analysis objects. A line produces a temperature profile, an area produces a histogram, and corresponding objects from multiple images can be shown as a trend. The available tabs depend on the current image and analysis objects.
Image thumbnails
The Image Thumbnails window is a filmstrip of infrared images in the current folder. The focused image appears in the analysis area.
Temperature scale
The Scale window maps the displayed temperature range to the selected palette and provides controls for changing both. It works the same way in Analyzer and Organizer modes. See Temperature scale window.
Folders
The Folders window provides access to folders on the computer and network. Selecting a folder displays its infrared images in the Image Thumbnails window.
Show or hide windows
Use the View menu to control the Analyzer workspace:
·View > Windows: Show or hide Image Thumbnails, Temperature Scale, Graphs, or Properties.
·View > Notations: Show or hide the Notations window.
·View > Folders: Show or hide the Folders window. The keyboard shortcut is Ctrl+Shift+F.